Meteor Radio Reflection Detection
- Matthew Earnshaw (M3MNH)
Many thanks to Hiroshi Ogawa of the International Project for Radio Meteor Observation
for picking up on and using my data in his analysis
of the 2009 Leonids.
Raw data
August 2010: Download (450 KB)
August 2009 - January 2010: Download (1.32 MB)
2010 Perseids
Detailed analysis to follow.
2009 Perseids
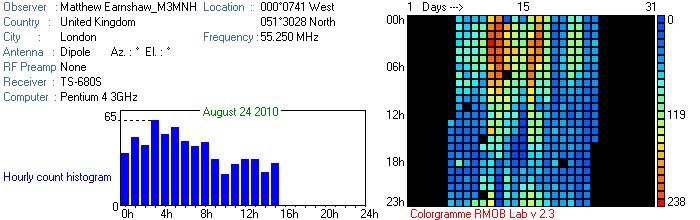
Shown are the results of radio observation during the period of the 2009 Perseids (10/08-15/08/09).
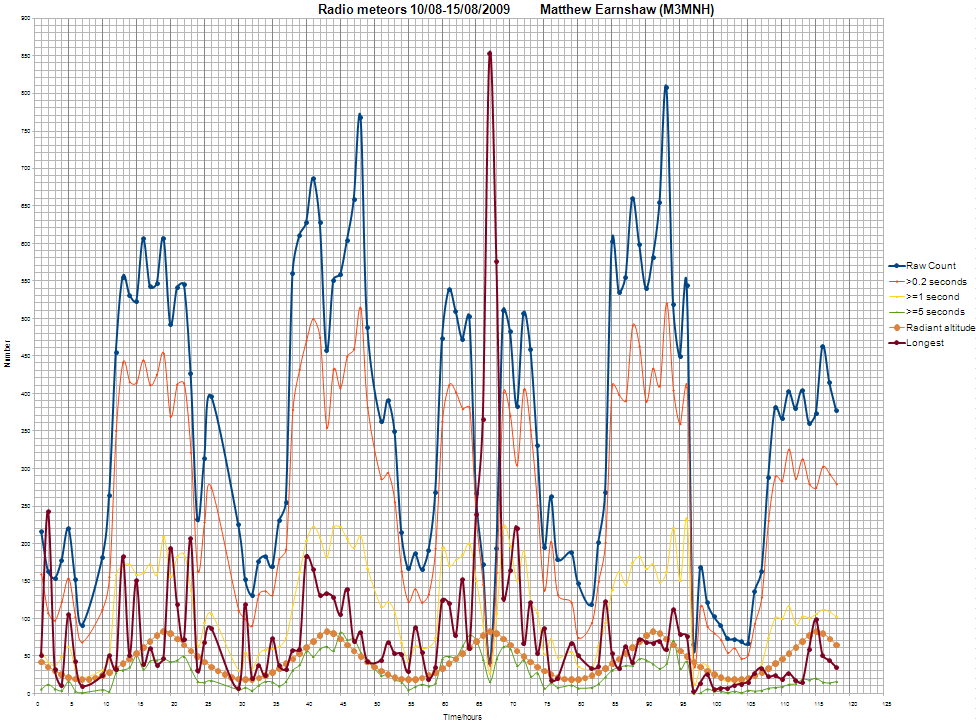
A graph of radio meteors over the peak time of Perseids. The diurnal cycle is clearly visible. It's worth noting that the meteor count peaks correlate with the radiant's altitude shown here as the regularly undulating orange line. The lines show different levels of filtering. The red line is the longest echo in seconds for that hour. The peak in the red line corresponds to the shower peak. The count is lower here because the spectrogram was saturated and many many meteors blended into long ones. This is why the red line is included, or else the peak would be obscured.
Amplitude vs Duration

My interpretation of this plot is to treat it like a Hertzsprung-Russell diagram, showing classification of different "types" of meteors, by size, velocity and angle of entry rather than composition. The plot actually contains several thousand data points taken from the data set that can be downloaded above. The vast majority are underdense trails, with duration lasting no more than a second or so. Then there are the overdense trails, those with duration >5 or so seconds. Then there are the exception reflections lasting up to several minutes. As expected there is weakly positive correlation between echo duration and the amplitude of the reflected signal, a large meteoroid will give persistant and strong ionisation. However, looking at the underdense meteors, there appears to be a roughly normal distribution with some very intense short bursts or the occasion weak but persistent echo. There are many causes of this from atmospheric windshear to location of the meteor between receiver and observer, angle of entry, and even erroneous data point caused by interference from sporadic-E (another reason why raw audio recordings would be good in an ideal system).
Frequency of duration of echoes
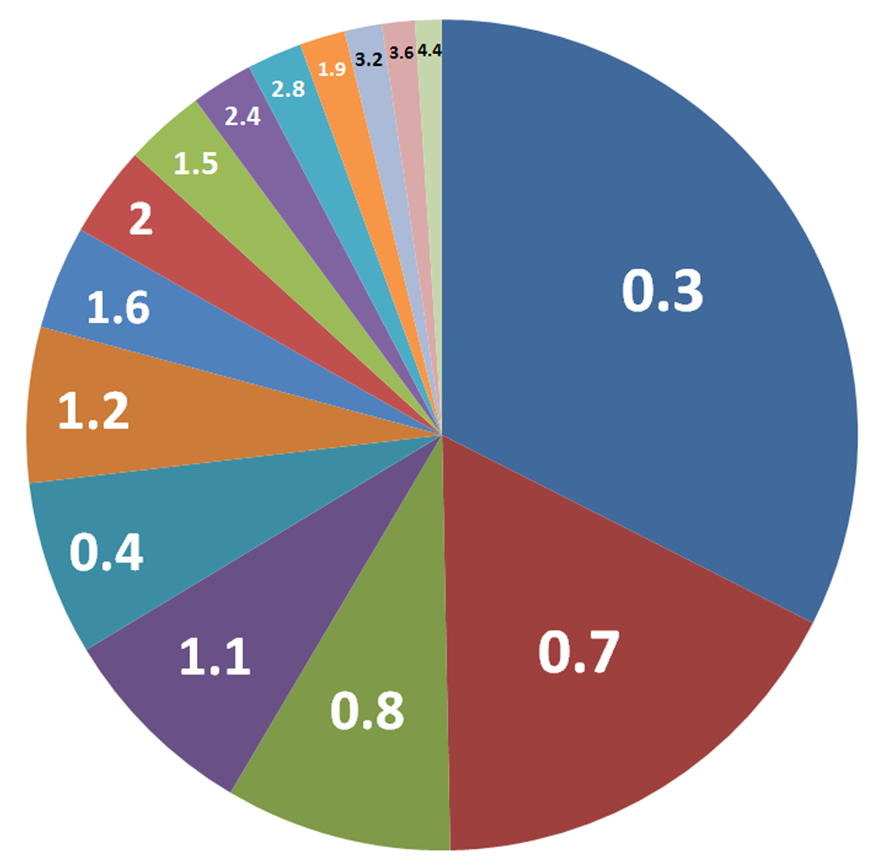
This pie chart is based on several thousand data points, and demonstates that the vast majority of reflections are from underdense trails that persist for only a fraction of a second. Overdense meteors (which can only be categorised very loosely as lasting "several seconds to several minutes" in duration terms), account for a tiny fraction of observed echoes.